
Top-5 data points that weren't around just a few years ago
The explosion of data capture has delivered new metrics for reporting, performance growth and predictive analytics in sports. This data-driven revolution created certain metrics, especially in sports like football, baseball, basketball, soccer, and tennis, that are becoming commonly used in the reporting of game trends on TV/streaming and in recaps online and in print. These are some of my favorite “new” (or “next gen”) data points that have become commonplace in today’s games but weren’t considered common (or were even in existence) just a few years ago*.
(*Please note: The actual duration of “just a few years ago” is subject to reader interpretation. Carry on.)
1. Football: Pressure Metrics
While traditional statistics focus on pass completion rates and tackles, pressure metrics offer a nuanced view of defensive effectiveness. This data measures how defensive players' presence affects the opposing team's QB decision-making, potentially leading to turnovers or mistakes. By analyzing pressure metrics, teams can identify unsung heroes whose strategic positioning disrupts opponents beyond conventional stats. Pressure is defined as a pass-rush play where the rusher affects the QB before the pass is thrown. A pass rush becomes a pressure when pressure probability exceeds 75 percent. This includes sacks, QB hits, QB hurries and other plays where the pass rusher comes into close proximity with the quarterback; it will also include plays where the pass rusher has a free path to the QB or is winning the matchup with the blocker. For recent context, Patrick Mahomes faced 32 QB pressures in the Super Bowl; Brock Purdy 20. Pressure rate has led to pressure probability statistics, too. This affects both sides of the ball in terms of performance data, as offensive lineman are obviously tracked on pressures allowed, pressure rate allowed, etc.
2. Baseball: Spin Rate Analysis
Pitching strategies often revolve around velocity and movement, but the spin rate of pitches is a less-tapped analytic. A higher spin rate can lead to more pronounced pitch movements, deceiving batters and improving strikeout rates. Understanding and optimizing spin rates can help pitchers refine their arsenal, making them more formidable on the mound. Emanating out of MLB’s Statcast, the spin rate has been tracked with increased precision since 2015. The 2023 season provided the most accurate data yet, as a higher spin rate makes hitting much harder and batters tend to strike out much more often. And again, this data is used well beyond in-game and postgame recaps. Just ask the latest free agent class.


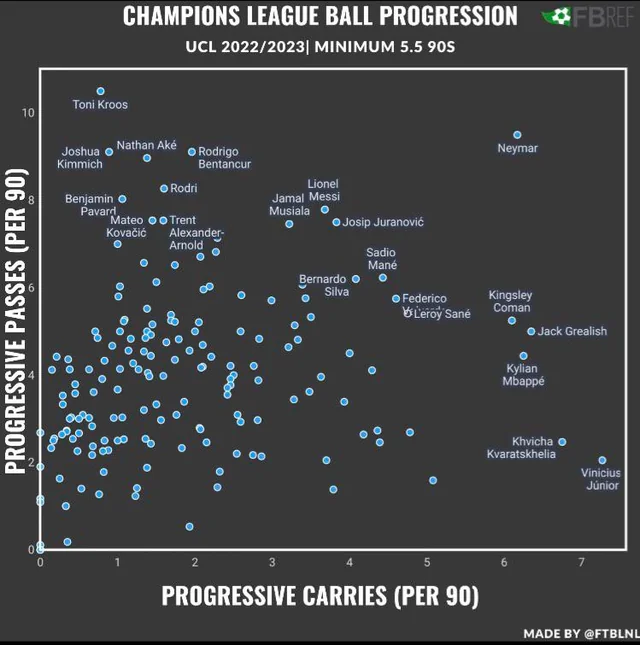


Photo Courtesies: IBM, FTBLNL.
3. Basketball: Plus-Minus (and its derivatives)
I absolutely love the “traditional” plus-minus stat. It has been tracked in the NBA since 2007-08 season - which to some still counts as a relatively “new” addition. Plus-minus merely keeps track of the net changes in the score when a given player is either on or off the court. It’s a simple way to help underscore the overall impact a player can have on the game. What I love about this stat are the iterations it has created to help make the plus-minus become even more focused. ESPN created a Real Plus-Minus (RPM) which essentially creates a number that identifies each player’s actual impact by adjusting for the effects of each teammate and opposing player on the court, too. Other plus-minus derivatives include adjusted plus-minus, defensive plus-minus, estimated plus-minus and so many more! Check out a list here. And then have some fun with NBA Advanced Stats.
4. Soccer: Progressive Passes
Soccer's beauty lies in its fluidity and teamwork. While goals and assists capture the spotlight, progressive passes — those that significantly advance the ball towards the opponent's goal — are critical yet undervalued. These passes are indicators of a team's attacking intent and can pinpoint players pivotal in transitioning from defense to attack. Specifically, a progressive pass is one that moves the ball 10 yards (30 feet) closer to the goal than it's been recently, or any completed pass into the opponent's penalty area. This data started to become the norm in the early 2010s – again, somewhat “recently” depending on who you’re talking to.
5. Tennis: Distance Run
Tennis often celebrates aces and winners, but rally length analytics reveal a player's endurance and strategy. More than that, these world-class athletes are alone on a court with a single opponent (in singles play anyway). They’re often engaged in matches lasting hours upon hours upon hours. And tracking the distance run over the course of these marathons is a great way to see how much they’ve run, but also to see how they stack up against each other. We know soccer players run a ton more than most athletes*, which is why comparing players within the same sport is particularly valuable. Andre Agassi was an all-timer in terms of manipulating the action so his opponent would have to chase sideline-to-sideline while he stayed within a single spot or location. This data came to the forefront in the 2010s as well.
*As an aside, the order of most distance run by sport (miles/game) are: Soccer (7 mi), Field Hockey (6), Tennis (5), Basketball (3), and Football (1.2 for CBs and WRs).
As the sports world continues to evolve, tapping into these undervalued data analytics can provide teams and athletes with unique insights and advantages. By broadening the scope of analytics used, the sports industry can uncover new dimensions of performance, strategy, and competition, pushing the boundaries of what's possible on the field, court, or pitch. These are my faves. How about you?
Comments